3 Technical Indicators You Should Know
Hint: you can use these to better time your entry even if you don't trade
Learning to trade can be an overwhelming experience - there’s so much to learn (from macroeconomics to behavioral finance) and so many trading indicators to choose from!
At TBH, we want to help you simplify your investing journey.
The truth is this; you can do pretty well with just 3 technical indicators.
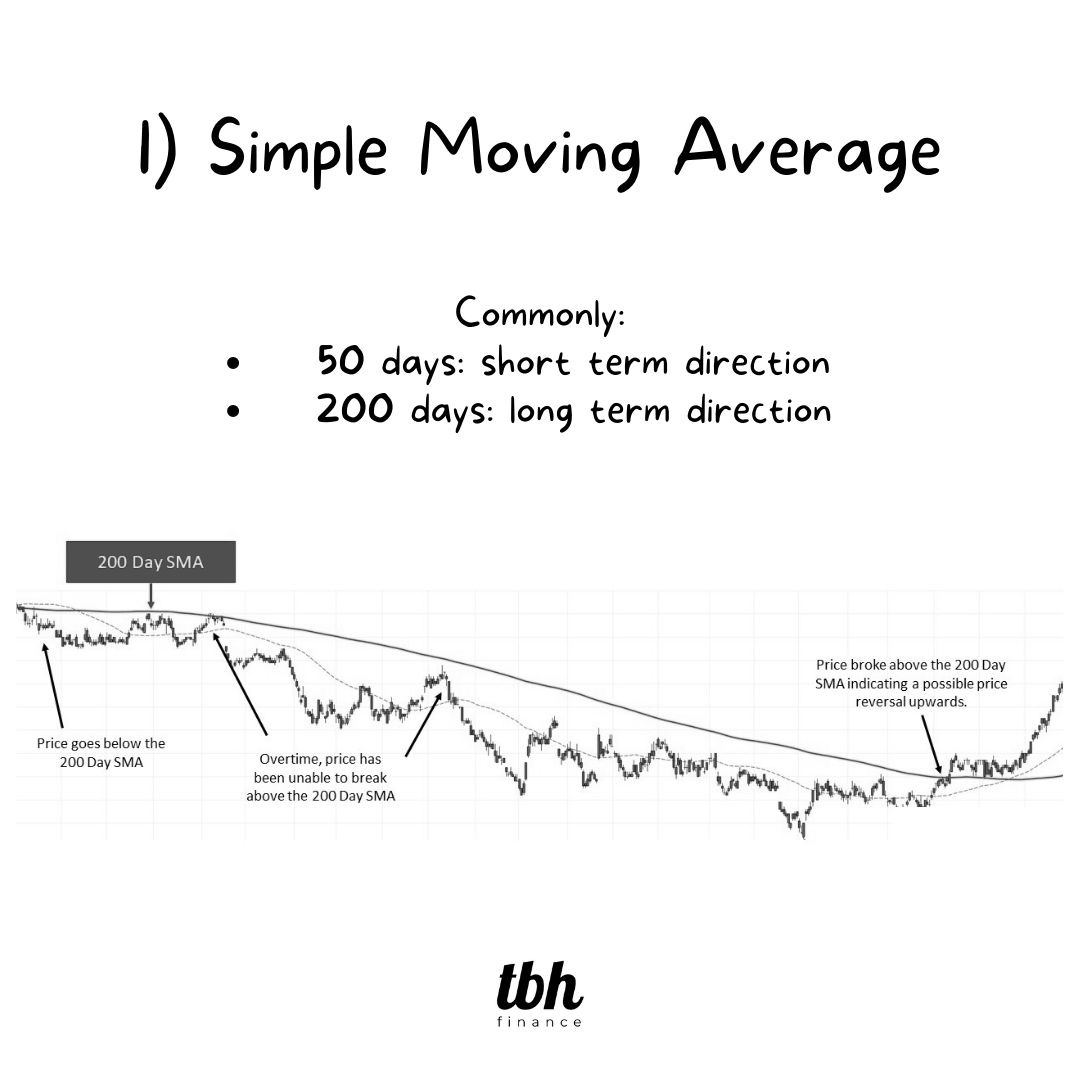
1) Simple Moving Average (SMA)
Don’t dismiss this basic indicator!
The Simple Moving Average smoothens stock price over a period of time and gives you a better idea of where the stock is heading.
The best part?
This indicator is so basic, you’ll find that it is available on almost any platform you use, for free.
2) Bollinger Bands
Bollinger Bands in my opinion are best used in the shorter term. It gives you an idea of the stock's momentum.
Basically, if the price hits the upper band of the channel, the stock will likely lose momentum and retrace down. The opposite is true too.
3) Relative Strength Index (RSI)
The RSI gives you an idea if a stocks is overpriced (aka overbought) or underpriced (aka oversold).
When a stock is said to be overbought, there’s a higher chance of a downward correction in the short term. The opposite true when a stock is said to be oversold.
💡How I use these indicators to make better decision?
Ever bought a stock after doing your research, only to see its price drop after your transaction goes through?
That feeling sucks. 😔
Hence, “When is a good time to buy?” is a question that DIY investors like us always struggle with.
I combine these three indicators to give me a birds-eye view of a stock’s current price movement. If it looks overbought or the momentum looks like it would weaken, I would wait for a better opportunity to enter. Vis versa, if a stock looks hyped up according to the charts (*cough* NVDA *cough*), I would take some profits off the table.
I hope these three technical indicators can help you make better investment decisions too! Good luck in the markets!


